
Networking · head to head
Prometheus vs Uptime.com

Prometheus
Networking
Open source monitoring and alerting toolkit for cloud native environments
- From
- Free
- Rated
- -
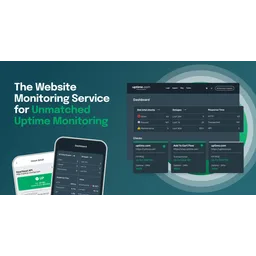
Uptime.com
Logging
Website monitoring and uptime checker with 80+ global monitoring points
- From
- On request
- Rated
- -
The short version
- Only Prometheus has a free tier, so it costs nothing to try first.
- Each has a real cost: Prometheus not suitable for per-request billing as collected data lacks 100% accuracy; Uptime.com pricing structure not fully detailed publicly
- They diverge on capability: Prometheus covers Multi-dimensional Data Model, Uptime.com covers Website monitoring.
- Prices and features above were last checked on 30 August 2026.
Where they differ
Only the attributes on which Prometheus and Uptime.com actually diverge.
| Attribute | Prometheus | Uptime.com |
|---|---|---|
| Starting price | Free | On request |
| Pricing model | open-source | subscription |
| Free tier | Yes | No |
| Platforms | Linux, macOS, Windows | Web, API |
| Category | Networking | Logging |
| Founded | 2015 | Unknown |
Identical on both: user rating (Not yet rated).
What each one covers
Drawn from each product's published feature list. An absence here means we hold no record of it - not that the product lacks it.
Only in Prometheus
- Multi-dimensional Data Model
- PromQL Query Language
- Pull-based Collection
- Service Discovery
- Alerting Rules
- Federation
- Local Storage
- Grafana
Only in Uptime.com
- Website monitoring
- API monitoring
- Synthetic monitoring
- Page speed testing
- Real User Monitoring
- Status pages
- Private locations
- Global network
What people use each for
The jobs each tool is most often brought in to do.
Prometheus
- Monitoring and alerting systemnot Uptime.com
- Time-series databasenot Uptime.com
- Infrastructure metrics collectionnot Uptime.com
Uptime.com
- Monitor website availability across multiple global locationsnot Prometheus
- Test API endpoints and validate response timesnot Prometheus
- Verify DNS resolution and certificate validitynot Prometheus
- Track page load performance over timenot Prometheus
- Send alerts to teams when issues occurnot Prometheus
Where each one falls short
Documented limitations, not opinions. Every one is a constraint you would hit in normal use.
Prometheus
- Not suitable for per-request billing as collected data lacks 100% accuracy
- Hard limit on scrape body size; large responses cause scrape failure
- Per-scrape sample limit enforced; exceeding limit marks targets as failed
- Not designed for long-term durable storage; optimised for metrics collection
Uptime.com
- Pricing structure not fully detailed publicly
- Limited information on check frequency in basic plans
- Real User Monitoring and status pages require add-ons
- Lower-tier plans may have feature limitations
Pricing, plan by plan
Prometheus
Free- Prometheus (Open Source)Free
- 100% open source
- Community-driven project
- Apache 2 License
Uptime.com
On requestNo published plan breakdown. See the Uptime.com review.
Which should you pick?
Choose Prometheus if
- You need multi-dimensional data model.
- You want to start without paying.
- You work on Linux, macOS, Windows.
- You also want promql query language.
Choose Uptime.com if
- You need website monitoring.
- You work on Web, API.
- You also want api monitoring.
Questions people ask
- Is Prometheus or Uptime.com better?
- Neither clearly leads. Prometheus starts at Free and Uptime.com at On request, and user ratings are close enough to be indistinguishable. Choose on capability and platform support.
- Which is cheaper, Prometheus or Uptime.com?
- Prometheus has a free tier; the other does not. Paid plans start at Free for Prometheus and On request for Uptime.com.
- Does Prometheus or Uptime.com run on more platforms?
- Prometheus runs on Linux, macOS, Windows. Uptime.com runs on Web, API.
- Can I use Prometheus for free?
- Yes. Prometheus has a free tier, so you can try it without paying. Uptime.com starts at On request.
- What is Prometheus best used for?
- Prometheus is most often used for monitoring and alerting system, time-series database, infrastructure metrics collection. Of those, monitoring and alerting system and time-series database are not what Uptime.com is typically brought in for.
- What can Prometheus do that Uptime.com cannot?
- Prometheus covers Multi-dimensional Data Model, PromQL Query Language, Pull-based Collection, Service Discovery. Uptime.com covers Website monitoring, API monitoring, Synthetic monitoring, Page speed testing.
Answered from the vendors’ own pages
Prometheus: What does Prometheus cost?
Prometheus is completely free and open source. There are no pricing tiers or paid plans. The entire project is licensed under Apache 2 and hosted on GitHub.
SourceUptime.com: Does Uptime.com offer a money-back guarantee?
Yes, Uptime.com provides a 30-day money-back guarantee for new users, allowing risk-free trial of their service.
SourcePrometheus: Is Prometheus commercial software or free?
Prometheus is 100% open source and community-driven. It is a CNCF graduated project with no commercial restrictions or licensing fees.
SourceUptime.com: What alerting methods does Uptime.com support?
All plans include email and SMS alerting with 20+ integrations available including Slack, Teams, PagerDuty, and webhooks for custom integrations.
SourcePrometheus: How is Prometheus licensed?
Prometheus is licensed under the Apache 2 License, which permits free use, modification, and distribution for commercial and non-commercial purposes.
SourceUptime.com: How many monitoring locations does Uptime.com have?
Uptime.com operates 80+ monitoring locations worldwide, enabling checks from multiple geographic regions to detect regional connectivity issues.
SourceRelated pages
Other head to heads
- Prometheus vs Traefik
- Prometheus vs Grafana
- Prometheus vs Cloudflare
- Prometheus vs Consul
- Prometheus vs Tailscale
- Prometheus vs Ivanti
- Prometheus vs Ubiquiti UniFi
- Prometheus vs Palo Alto Networks
- Prometheus vs Splunk
- Prometheus vs Zabbix
- Prometheus vs Netdata
- Prometheus vs LibreNMS
- Prometheus vs Domotz
- Prometheus vs Headscale
- Prometheus vs HiveMQ
- Prometheus vs OPNsense
- Prometheus vs ThousandEyes
- Prometheus vs Checkly
- Prometheus vs Cronitor
- Prometheus vs New Relic
- Prometheus vs Healthchecks
- Prometheus vs InfluxDB
- Prometheus vs Traceloop
- Prometheus vs Openstatus
- Prometheus vs incident.io
- Prometheus vs AppDynamics
- Prometheus vs Axiom
- Prometheus vs Better Stack
- Prometheus vs Honeybadger
- Prometheus vs Papertrail
- Prometheus vs Raygun
- Prometheus vs Retrace
- Prometheus vs Rollbar
- Prometheus vs Sematext
- Prometheus vs New Relic Logs
- Uptime.com vs Traefik
- Uptime.com vs Grafana
- Uptime.com vs Cloudflare
- Uptime.com vs Consul
- Uptime.com vs Tailscale
- Uptime.com vs Ivanti
- Uptime.com vs Ubiquiti UniFi
- Uptime.com vs Palo Alto Networks
- Uptime.com vs Splunk
- Uptime.com vs Zabbix
- Uptime.com vs Netdata
- Uptime.com vs LibreNMS
- Uptime.com vs Domotz
- Uptime.com vs Headscale
- Uptime.com vs HiveMQ
- Uptime.com vs OPNsense
- Uptime.com vs ThousandEyes
- Uptime.com vs Checkly
- Uptime.com vs Cronitor
- Uptime.com vs New Relic
- Uptime.com vs Healthchecks
- Uptime.com vs InfluxDB
- Uptime.com vs Traceloop
- Uptime.com vs Openstatus
- Uptime.com vs incident.io
- Uptime.com vs AppDynamics
- Uptime.com vs Axiom
- Uptime.com vs Better Stack
- Uptime.com vs Honeybadger
- Uptime.com vs Papertrail
- Uptime.com vs Raygun
- Uptime.com vs Retrace
- Uptime.com vs Rollbar
- Uptime.com vs Sematext
- Uptime.com vs New Relic Logs